
You stand on the precipice of understanding, peering into a cosmic tapestry far grander than you could have imagined. For years, the universe has been a realm of tantalizing hints and fragmented glimpses. Now, with the unveiling of the largest 3D map of the universe, a staggering 47 million galaxies illuminated, you gain an unprecedented perspective on the cosmic web, the grand structure that binds everything together. This isn’t just a collection of pretty astronomical images; it’s a scientific achievement, a meticulously constructed atlas that reshapes our understanding of cosmic evolution and the fundamental forces at play.
The sheer scale of this endeavor is difficult to fully grasp. Imagine trying to map every grain of sand on every beach on Earth, then multiply that by a factor that dwarfs your imagination. This map, compiled from extensive surveys, represents a monumental effort by countless scientists and astronomers, pushing the boundaries of observational technology and data analysis. You are now privy to the organized distribution of matter across billions of light-years, a view that allows you to trace the lineage of structures from the earliest epochs of the universe to the present day.
The Genesis of a Cosmic Census
The creation of such a colossal map is not an overnight sensation. It is the culmination of decades of dedicated observation and technological advancement. The journey began with the realization that understanding the universe’s large-scale structure required more than just cataloging individual stars and galaxies. It necessitated a three-dimensional understanding of their distribution, revealing the patterns and voids that define the cosmic web.
Early Explorations of Galactic Distribution
Before you had access to this grand tapestry, astronomers grappled with limited data. Early attempts to map galaxies were often restricted to two dimensions, providing flattened projections of the cosmos. This inherent limitation meant that the true depth and interconnectivity of galactic structures remained obscured. The quest for accurate distance measurements became paramount, a challenging hurdle in astronomical observation.
The Redshift Revolution
A pivotal development in charting the cosmos was the understanding and application of redshift. Light from distant galaxies is stretched as the universe expands, causing it to shift towards the red end of the electromagnetic spectrum. By precisely measuring this redshift, astronomers could infer the velocity at which a galaxy is receding from us, and consequently, its approximate distance. This principle, the cornerstone of extragalactic astronomy, allowed for the nascent 3D mapping of the universe, albeit with much sparser data than you are now privy to.
The Rise of Large-Scale Sky Surveys
The transition from limited observations to comprehensive mapping required immense datasets. This is where the concept of large-scale sky surveys became indispensable. These ambitious projects systematically observed vast swathes of the night sky, capturing light from millions, and eventually billions, of celestial objects. The sheer volume of data generated by these surveys provided the raw material for constructing a detailed cosmic map.
Technological Hurdles and Innovations
The creation of these surveys presented significant technological challenges. Developing telescopes capable of observing fainter and more distant objects, and instruments that could accurately measure redshift for millions of galaxies, required constant innovation. From improved lens technology and detector sensitivity to advanced spectrographs, each advancement contributed to the growing precision and scope of these cosmic catalogs.
The recent breakthrough in astrophysics, highlighted in the article about the largest-ever 3D map of the universe, which reveals 47 million galaxies stretching from the Milky Way to the era known as ‘cosmic noon,’ has opened new avenues for understanding the cosmos. This monumental project not only enhances our knowledge of galaxy formation and distribution but also parallels advancements in other fields, such as digital engagement strategies. For instance, the use of interactive polls and quizzes can significantly boost email engagement, as discussed in this informative piece on how to effectively implement such tools. To learn more about enhancing your email strategies, you can read the article here: How to Use Interactive Polls and Quizzes to Double Your Email Engagement.
The Pillars of the 47 Million Galaxy Map
This monumental 3D map is built upon the foundations laid by several key observational efforts. You are essentially looking at an amalgamation of data from the most comprehensive surveys to date, each contributing a unique piece to the intricate cosmic puzzle. The synergy between these projects is what makes this map so powerful and informative.
The Sloan Digital Sky Survey (SDSS) Contribution
A significant portion of the data contributing to your current cosmic vista originates from the Sloan Digital Sky Survey (SDSS). This groundbreaking project, through its various iterations, has been instrumental in mapping the large-scale structure of the universe. Its continuous observations over several decades have yielded an unparalleled catalog of galaxies, quasars, and stars.
Spectroscopic Redshift Measurements
SDSS’s strength lies in its ability to obtain high-quality spectroscopic redshift measurements for an enormous number of celestial objects. This allows for precise distance determinations, a crucial element in constructing a 3D map. You are seeing galaxies not just as points of light, but as objects situated at specific cosmic distances, allowing for the visualization of their spatial relationships.
The Evolution of SDSS Data Releases
Over its lifespan, SDSS has had multiple data releases, each progressively larger and more comprehensive. These iterative releases have allowed the scientific community to refine existing cosmological models and explore new avenues of inquiry. The 47 million galaxy map you are now engaging with represents the cumulative wisdom and data gathered through these evolutionary stages.
The Dark Energy Spectroscopic Instrument (DESI) Expansion
The Dark Energy Spectroscopic Instrument (DESI) represents a next-generation leap in large-scale structure mapping. Its primary objective is to measure the expansion history of the universe with unprecedented precision, specifically focusing on the properties of dark energy. DESI’s observational capabilities significantly augment the data you are now observing.
Targeting the Cosmic Web’s Interconnections
DESI’s design is optimized to observe faint galaxies and quasars across vast cosmic distances. It aims to map the distribution of matter in a way that reveals the subtle imprints left by dark energy on the cosmic web. You are therefore not only seeing the distribution of galaxies but also the underlying scaffolding of dark matter distribution, which influences how galaxies cluster and move.
Unraveling Dark Energy’s Influence
By precisely mapping the cosmic web, DESI aims to constrain the properties of dark energy, the mysterious force driving the accelerated expansion of the universe. This means that the map you are viewing provides crucial data for understanding a fundamental force that dictates the universe’s ultimate fate.
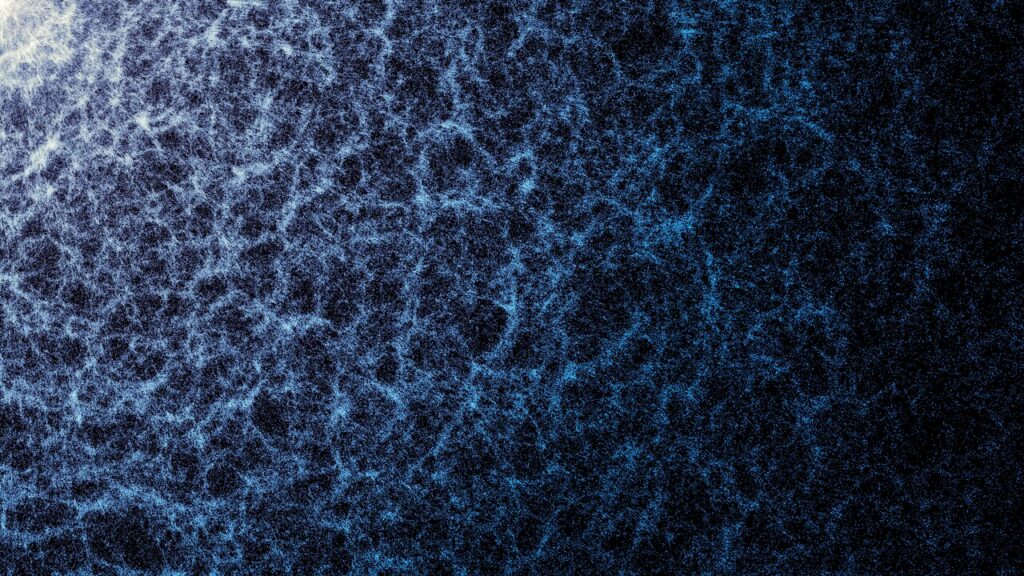
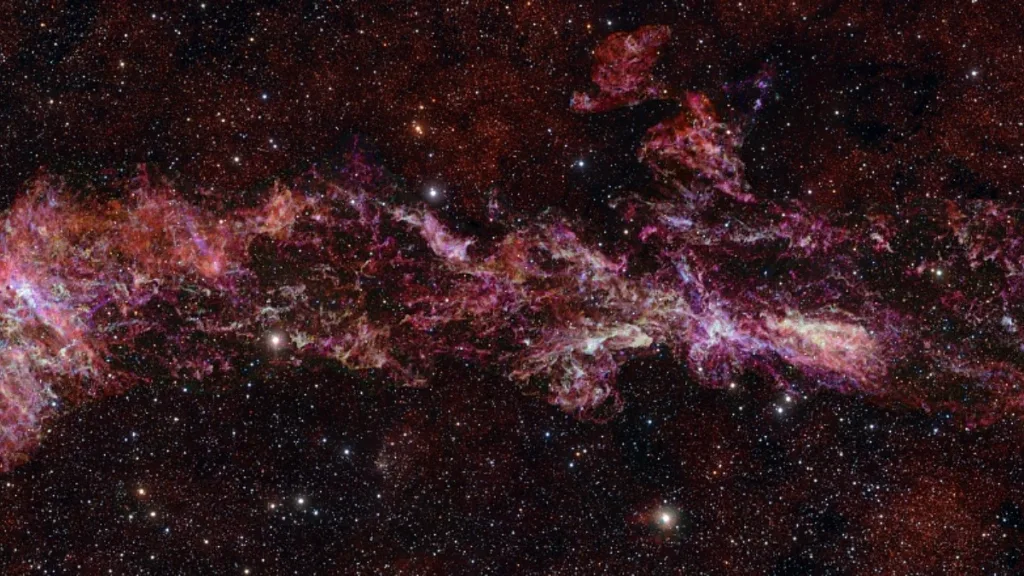
Deciphering the Cosmic Web
The 47 million galaxies are not randomly scattered; they form a complex, interconnected structure known as the cosmic web. This web is characterized by vast, empty regions called voids, surrounded by intricate filaments and nodes where galaxies cluster densely. Understanding this structure is key to comprehending cosmic evolution.
The Architecture of Filaments and Voids
Imagine a three-dimensional spiderweb spun across the cosmos. This is a simplified analogy for the cosmic web. The filaments are the threads, comprising elongated chains and sheets of galaxies. These filaments are punctuated by nodes, the dense clusters where hundreds or even thousands of galaxies congregate. The vast expanses between these structures are the voids, regions that are largely devoid of luminous matter. You are now observing this architecturally profound arrangement.
Gravitational Collapse and Structure Formation
The cosmic web is a direct consequence of gravity’s relentless pull acting on the initial slight density fluctuations in the early universe. Over billions of years, gravity amplified these fluctuations, drawing matter together into the filaments and halos that you can now see. Denser regions collapsed first, forming galaxies and galaxy clusters, while less dense regions expanded into voids.
The Role of Dark Matter
While you are seeing luminous galaxies, the underlying scaffolding of the cosmic web is primarily composed of dark matter. This invisible substance interacts gravitationally but does not emit or absorb light, making it undetectable through direct observation. However, its gravitational influence shapes the distribution of visible matter, guiding the formation of the cosmic web. You are seeing the visible manifestation of this dark matter scaffolding.
Understanding Galaxy Clustering and Evolution
The clustering of galaxies within the cosmic web provides crucial insights into their formation and evolution. Galaxies don’t exist in isolation; they interact with their neighbors, merge, and influence each other’s growth. The map you are examining allows you to study these interactions on a grand scale.
The Influence of Cosmic Neighbors
Within the dense nodes and filaments of the cosmic web, galaxies experience strong gravitational interactions. These interactions can lead to mergers, triggering bursts of star formation and the growth of supermassive black holes at their centers. By studying galaxies in different environments within the map, you can observe the effects of these interactions in action.
Tracing Galaxy Mergers and Interactions
The 3D map allows you to identify galaxies that are in the process of merging or have recently undergone mergers. These events are crucial for understanding how galaxies grow and evolve over cosmic timescales. You are witnessing the history of galactic evolution written in the spatial distribution of these celestial bodies.
Implications for Cosmology and Fundamental Physics
The unveiling of this comprehensive 3D map of the universe is far more than an astronomical catalog; it is a powerful tool for testing and refining our understanding of the fundamental laws that govern the cosmos. It provides the empirical data needed to address some of the most profound questions in physics.
Testing Cosmological Models
Cosmological models are theoretical frameworks that describe the origin, evolution, and eventual fate of the universe. This new map offers an unprecedented dataset for validating these models. By comparing the observed distribution of galaxies with predictions from different models, scientists can identify which theories best fit reality.
Constraining Cosmological Parameters
The parameters within these models, such as the density of dark matter and dark energy, and the rate of cosmic expansion, can be precisely constrained by the data from this map. You are observing the empirical evidence that allows scientists to fine-tune their understanding of the universe’s fundamental constituents and their proportions.
The Standard Cosmological Model (Lambda-CDM)
The prevailing cosmological model, known as Lambda-CDM, proposes that the universe is composed primarily of cold dark matter (CDM) and dark energy (represented by Lambda). This map provides crucial data to test the predictions of Lambda-CDM and potentially identify areas where it may need modification or expansion. You are contributing to the ongoing validation or refinement of this cornerstone model.
Probing the Nature of Dark Energy and Dark Matter
The dominant components of the universe – dark energy and dark matter – remain largely enigmatic. This 3D map is instrumental in shedding light on their properties and their influence on cosmic structure formation. You are directly engaging with the evidence that helps demystify these cosmic mysteries.
Dark Energy’s Effect on Expansion
The distribution of galaxies across vast distances, as depicted in this map, is directly influenced by the expansion history of the universe, which is dominated by dark energy. By studying the patterns of cosmic structure, particularly the growth of voids and filaments, scientists can gain insights into the nature and strength of dark energy. You are seeing the large-scale consequences of this elusive force.
Dark Matter’s Gravitational Fingerprint
While invisible, dark matter’s gravitational pull is essential for the formation of the cosmic web. This map allows scientists to infer the distribution of dark matter by observing how it affects the clustering of visible galaxies. You are observing the gravitational “fingerprint” of dark matter, revealing its pervasive influence on the universe’s structure.
The recent breakthrough in astrophysics, highlighted in the article about the largest-ever 3D map of the universe revealing 47 million galaxies, offers a fascinating glimpse into the cosmos from the Milky Way to what is known as ‘cosmic noon.’ This monumental achievement not only enhances our understanding of galaxy formation and distribution but also complements other scientific explorations, such as the importance of focused time management in achieving significant goals. For instance, the concept of dedicating 60 minutes to your most important objective can be seen as a parallel to the meticulous efforts required in mapping the universe. To learn more about this approach, you can read about it in this insightful article on the art of the power hour.
Your Window to the Cosmic Evolution
This 47 million galaxy 3D map is not a static snapshot; it’s a journey through time. The light you observe from distant galaxies has traveled for billions of years, meaning you are looking back to the universe’s past. This allows you to trace the evolution of cosmic structures and understand how the universe transformed from its early, nearly uniform state to the complex web you see today.
Observing the Universe Through Cosmic Time
The concept of lookback time is fundamental to understanding this map. Galaxies that are farther away are seen as they were in the distant past, when the universe was younger. This allows you to observe different stages of cosmic evolution within a single map. You are, in essence, navigating through a historical record.
From the Early Universe to Today
By examining galaxies at various distances, you can witness the gradual formation of the cosmic web. You can see how the initial, subtle density fluctuations grew over time, leading to the development of filaments, voids, and clusters. You are observing the unfolding narrative of cosmic self-assembly.
The Formation of the First Structures
The map provides data on galaxies that formed relatively early in the universe’s history. Studying these early galaxies helps astronomers understand the processes that led to the formation of the very first stars and galaxies, a crucial step in building the cosmic structures we observe today. You are gaining insight into the universe’s genesis.
Future Prospects and Unanswered Questions
While this 3D map represents a monumental achievement, it also opens up new avenues of inquiry and highlights lingering mysteries about the universe. The knowledge you gain from it is not an end point, but a launching pad for future exploration.
Refining Observational Techniques
The success of these large-scale surveys will undoubtedly spur further advancements in observational techniques. Future telescopes and instruments will aim for even higher precision, greater depth, and broader sky coverage, allowing for even more detailed maps and deeper investigations into cosmic phenomena. You are witnessing the fruits of past innovation that will pave the way for future discoveries.
The Quest for Cosmic Homogeneity
Despite the intricate structure of the cosmic web, on the largest scales, the universe appears to be remarkably homogeneous and isotropic (the same in all directions). This map provides data to test the limits of this homogeneity and to explore potential deviations that could point to new physics. You are observing where the universe adheres to predictable patterns and where it might defy them.
The Fundamental Nature of Reality
Ultimately, this map of 47 million galaxies is a testament to humanity’s enduring desire to comprehend our place in the cosmos. It provides the observational bedrock for grappling with fundamental questions about the nature of reality, the forces that shape existence, and the ultimate destiny of the universe. You are participating in this grand intellectual pursuit.
FAQs
What is the largest-ever 3D map of the universe?
The largest-ever 3D map of the universe is a detailed map that shows 47 million galaxies from the Milky Way to ‘cosmic noon’. It is a comprehensive representation of the distribution of galaxies in the universe.
How was the map created?
The map was created using data from the Dark Energy Spectroscopic Instrument (DESI) project, which collected information on the positions and distances of millions of galaxies. The project used a specialized instrument to measure the light from these galaxies and determine their distances from Earth.
What is the significance of this map?
This map is significant because it provides a detailed and comprehensive view of the large-scale structure of the universe. It allows scientists to study the distribution of galaxies and better understand the evolution of the universe over billions of years.
What is ‘cosmic noon’?
‘Cosmic noon’ refers to a time in the history of the universe when galaxies were forming stars at the highest rate. The 3D map includes galaxies from this period, allowing scientists to study the processes that were taking place at that time.
How will this map be used by scientists?
Scientists will use this map to study the large-scale structure of the universe, including the distribution of galaxies and the effects of dark energy and dark matter. It will also help researchers to better understand the processes that have shaped the universe over its history.